This article is part of our Academy Course titled Nagios Tutorial for IT Monitoring.
In this course, we provide a compilation of Nagios tutorials that will help you set up your own monitoring infrastructure. We cover a wide range of topics, from installation and configuration, to plugins and NRPE. With our straightforward tutorials, you will be able to get your own projects up and running in minimum time. Check it out here!
In our previous article (“Nagios Core Installation and Configuration on Ubuntu Server“), we defined Nagios Core plugins as extensions (either in the form of compiled binaries or executable scripts) that process command-line arguments, perform specific checks, and then return the results to the main program. Under the hood, plugins are an abstraction layer that link the Nagios daemon and the hosts and services being monitored.
In this guide we will dive more deeply into Nagios Core plugins and what you can do with them.
Additionally, we will introduce you to NRPE (Nagios Remote Plugin Executor), an utility that will allow you to run Nagios Core plugins remotely both in Linux and Microsoft Windows machines to check metrics such as disk space usage and CPU load.

A closer look at Nagios Core plugins
In the first guide, we also downloaded and installed the official Nagios Core plugins, which consists of ~50 binary files (located in /usr/local/nagios/libexec) that are officially developed and maintained by the project. With these plugins you can check the status of common services like SMTP, SSH, HTTP, DNS (to name a few examples), plus some other machine-specific information such as uptime and disk space usage.
In addition, there are around 3000 plugins that have been developed and are maintained by the community under the name of Nagios Exchange. Together with the official plugins, they can be used to monitor “just about everything that runs on electricity”, as the Nagios project advertises.
Let’s take a closer look at the configuration file for the CentOS 7 system we defined previously. The service definition is of particular interest:
define service {
use                     local-service
host_name               centos7
service_description     HTTP
check_command           check_http!-I 192.168.0.29 -u /index.html
notifications_enabled   1
}
Let’s examine the line beginning with check_command. This directive is followed by the command Nagios will use to check the status of the service in the remote host (check_http) and the required parameters after the exclamation sign (-I 192.168.0.29 -u /index.html in this case).
Fortunately, plugins are highly customizable in that you can pass parameters to indicate exactly what you need to monitor and where. For example, what happens if the remote HTTP service is listening on a port other than the default 80? What if you need to check whether the certificate in a SSL enabled server will still be valid after a given number of days? The check_http plugin allows to perform these checks and many more.
Let’s find out more about the usage of the plugin:
cd /usr/local/nagios/libexec
./check_http --usage
./check_plugin --help, where plugin can be dns, ftp, ssh, load, ups, or any of the plugins inside /usr/local/nagios/libexec).The help guide indicates that you can use the -p option (followed by the port number) to indicate that the HTTP server is running on a different port. Likewise, the -S option tells Nagios to connect via SSL. To point out the version you can optionally use a number between 1 and 3 (1 = TLSv1, 2 = SSLv2, and 3 = SSLv3).
Let’s change the port where Apache is listening on the CentOS 7 host to 8080. This will require the following change in the service definition:
check_command check_http!-I 192.168.0.29 -u /index.html -p 8080
The first 2 notifications in Fig. 1 shows the results of the checks BEFORE and AFTER port 8080 was enabled in the remote host’s firewall:

If you later enable SSL on the HTTP server, modify the check_command directive in the service definition as follows:
check_command check_http!-I 192.168.0.29 -u /index.html -S 1
Fig. 2 shows what you can expect in the Apache logs in the remote host under this scenario:
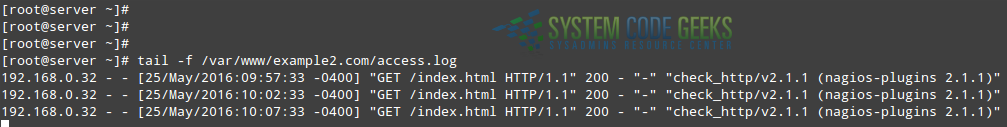
As you can see in Fig. 2 above, checks are performed at 5-minute intervals by default. If you want to change this setting, add the check_interval directive to the service definition followed by the desired number of minutes.
We can even go one step further and check if the SSL certificate in the remote host will still be valid for the next 366 days (it won’t if we followed the instructions given in Apache enable SSL / TLS tutorial). Feel free to choose a higher number if you wish.
To do this, change the check_command line as follows (please note that, according to the help guide, the URL is not checked when verifying the validity of a certificate – that is why we removed the -u option):
check_command check_http!-I 192.168.0.29 -C 366
Nagios will perform the check and return a warning, as you can see in Fig. 3:
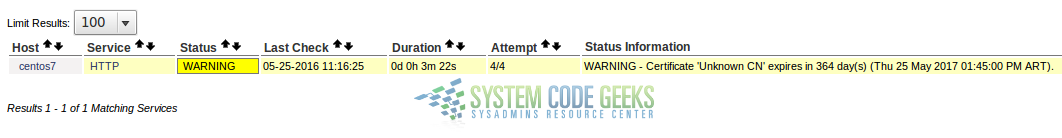
After you’re done with the above test, you should change the certificate expiration check to a more reasonable value (60 days, for example). This will warn you to renew the certificate when its expiration date is less than 2 months ahead:
check_command check_http!-I 192.168.0.29 -C 60
Introducing Nagios Remote Plugin Executor (NRPE)
Up to this point you have learned how to use plugins to check the status of network services on remote hosts from a centralized Nagios server, without having to install any agents on those remote hosts. If, additionally, you need to verify other metrics such as disk usage, CPU load, number of logged-on users, you will need to consider using NRPE.
This tool consists of a service that allows the Nagios server to execute plugins on remote machines and report the results back to the server. In short, the check_nrpe plugin on the Nagios server communicates with the NRPE service running on the remote host, which in turn runs the desired plugin (check_load, for example) locally.
In order to use NRPE (the package name is nrpe in Fedora-based distributions and nagios-nrpe-server in Debian and derivatives), let’s set up the remote CentOS 7 host:
Step 1 – Download and compile NRPE and configure it to run under xinetd:
yum install xinetd
wget https://sourceforge.net/projects/nagios/files/nrpe-2.x/nrpe-2.15/nrpe-2.15.tar.gz
tar xvf nrpe-2.15.tar.gz
cd nrpe-2.15
./configure
make all
make install-plugin
make install-daemon
make install-daemon-config
make install-xinetd
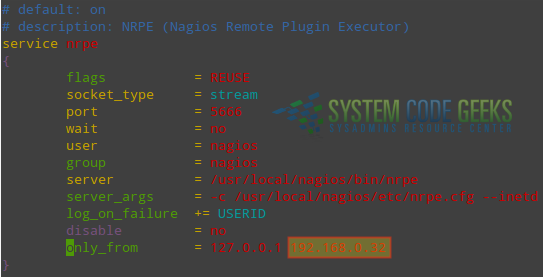
Edit /etc/xinetd.d/nrpe and allow connections from the Nagios server (192.168.0.32), as shown in Fig. 4:
only_from = 127.0.0.1 192.168.0.32
Step 2 – Create an user account and group (nagios)
useradd nagios
Step 3 – Define the commands to be used in the service declaration in the server:
Open /usr/local/nagios/etc/nrpe.cfg and make sure the following lines are present (see Fig. 5). You will want to replace the partition to be checked (/dev/mapper/centos_centos7–2-root) with the one that applies to your case.
command[check_users]=/usr/local/nagios/libexec/check_users -w 5 -c 10
command[check_load]=/usr/local/nagios/libexec/check_load -w 15,10,5 -c 30,25,20
command[check_disk]=/usr/local/nagios/libexec/check_disk -w 20% -c 10% -p /dev/mapper/centos_centos7--2-root
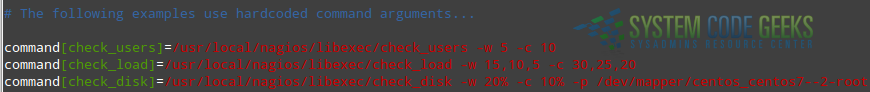
In each case, the -w and -c flags indicate the warning and critical thresholds, respectively. In other words, when the free disk space reaches the 20% threshold, NRPE will raise a warning message, whereas if the available space is 10% or less, a critical message will be issued. Likewise, you will receive warning and critical notifications when the CPU load reaches 15,10,5 and 30,25,20. The same is true for the number of logged-on users – warning and critical messages for 5 and 10 users.
Step 4 – Enable port 5666/tcp (the default port where NRPE listens on) in the built-in firewall:
firewall-cmd --add-port=5666/tcp
firewall-cmd --add-port=5666/tcp --permanent
And add the service description at the bottom of /etc/services:
echo "nrpe 5666/tcp # NRPE" >> /etc/services
Finally, start / enable xinetd to start on boot(this will manage the NRPE daemon):
systemctl start xinetd
systemctl enable xinetd
In this example, we are using xinetd to provide access control based on the IP address of the Nagios server, as we can see in Figure 4 above.
Step 5 – Set up the service definitions in the Nagios server (/usr/local/nagios/etc/servers/centos7.cfg):
define service {
use                     generic-service
host_name               centos7
service_description     Check load
check_command           check_nrpe!check_load
notifications_enabled   1
}
define service {
use                     generic-service
host_name               centos7
service_description     Check disk
check_command           check_nrpe!check_disk
notifications_enabled   1
}
define service {
use                     generic-service
host_name               centos7
service_description     Check logged-on users
check_command           check_nrpe!check_users
notifications_enabled   1
}
Please note how the parameters being passed to check_nrpe match the command definition in the remote host, as shown in Step 3.
Testing NRPE
As always, don’t forget to restart Nagios for the changes to take effect. Then go to the Nagios web interface and check the status of the metrics being monitored (refer to Fig. 6 for details):
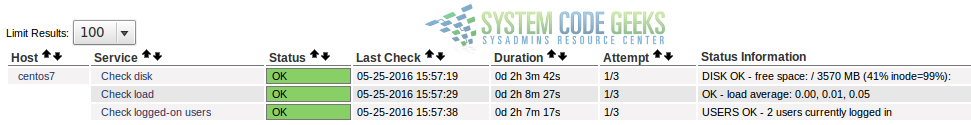
At this point, your Nagios server should be monitoring the disk usage, CPU load, and number of logged-on users in the remote CentOS 7 server.
/usr/local/nagios/var/nagios.log) in the server and the generic message log (/var/log/messages) in the remote host as the first source of information for troubleshooting.Summary
In this article we explained how to use Nagios plugins to monitor network services on remote hosts, and NRPE to monitor several machine-specific metrics on those hosts. How do you decide which one (generic plugins or NRPE) you should use? For simplicity, use the answers to the following questions to determine which approach applies to your case:
- Do you need to verify the status of network services running on remote hosts? Use plugins running on the central Nagios server.
- Do you need to check machine-specific metrics on the remote hosts? Use NRPE to run plugins on the remote hosts.
Last but not least, remember that Nagios is a monitoring tool and not Aladdin’s lamp. It does still require user intervention to prevent hardware damage when metrics go beyond the established limits, and human brains in action to troubleshoot issues when they occur. As with any other tool, you need to learn how to use it in order to make the most of it. We hope that this series will provide you with the necessary starting skills to accomplish that goal.
Happy monitoring!