This article is part of our Academy Course titled Nagios Tutorial for IT Monitoring.
In this course, we provide a compilation of Nagios tutorials that will help you set up your own monitoring infrastructure. We cover a wide range of topics, from installation and configuration, to plugins and NRPE. With our straightforward tutorials, you will be able to get your own projects up and running in minimum time. Check it out here!
In the previous two articles (Nagios Core Installation and Configuration on Ubuntu Server and Using Nagios plugins and NRPE to check network services and metrics on remote hosts) we discussed how to install Nagios Core, plugins and NRPE to monitor host status (up / down), several network services running on Linux servers, and machine-specific metrics such as the number of logged-on users, processes, and CPU load, to name a few examples.
Additionally, you can use the Simple Network Management Protocol (SNMP) with Nagios to manage other types of network devices, such as printers, routers, and switches. This will be the topic that we will address in this guide.

Prerequisites
As explained earlier, you will typically use SNMP with Nagios to monitor network devices, as opposed to using plugins or NRPE to check services and system information associated with a Linux system. However, you can still use SNMP in the latter case as well. For simplicity, we will use the same CentOS 7 box we have been utilizing so far.
In order to use the CentOS 7 box to simulate a regular network device, we will need to perform some preliminary work before proceeding. This prework will consist of the following steps:
Step 0 – Review basic SNMP concepts. Although a thorough discussion about SNMP is out of the scope of this article, we will try to point out the basics as we go. However, should you need a more detailed explanation, feel free to take a look at this excellent question (with answers) in the Ubuntu forums. Bookmark that page in case you need to refer to it for clarifications later.
Our test environment consists of the following key components (essential in SNMP monitoring):
- Managed device: CentOS 7 box.
- Agent: the snmpd service running on the CentOS machine.
- A Network Management System: Nagios running on the Ubuntu box.
Step 1 – Stop and disable xinetd (which will prevent the service from starting automatically on subsequent boots) on the managed device:
systemctl stop xinetd && systemctl disable xinetd
Step 2 – Install the SNMP packages on the Ubuntu box (this is required before proceeding with Step 3):
sudo apt-get install snmp snmpd libsnmp-dev
and in the CentOS 7 machine (necessary to monitor this host via SNMP):
yum install net-snmp net-snmp-utils
Finally, make sure that the snmpd service is started in the current session and on subsequent boots (CentOS):
systemctl start snmpd && systemctl enable snmpd
Step 3 – Recompile the Nagios plugins on the Ubuntu box. Since the SNMP packages were not installed at the time when we first compiled the plugins (see Step 9 in Nagios Core Installation and Configuration on Ubuntu Server for your reference), the check_snmp plugin could not be added to /usr/local/nagios/libexec.
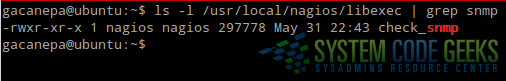
After completing Steps 2 and 3, verify that the check_snmp plugin is now present inside /usr/local/nagios/libexec, as indicated in Fig. 1:
ls -l /usr/local/nagios/libexec | grep snmp
Step 4 – Remove (or comment out) the lines in the /usr/local/nagios/etc/servers/centos7.cfg file except for the host definition (we will later add a couple of service definitions).
define host {
host_name               centos7
alias                   My CentOS 7 server
address                 192.168.0.29
max_check_attempts      3
check_period            24x7
check_command           check-host-alive
contacts                nagiosadmin
notification_interval   60
notification_period     24x7
}
Step 5 – Open port 161/udp on the CentOS 7 host (for your information, this is the port where SNMP traffic will be directed to):
firewall-cmd --add-port=161/udp
firewall-cmd --add-port=161/udp --permanent
Steps 0 through 5, as outlined above, represent the essential preparations in order for Nagios to monitor the CentOS 7 system via SNMP. In the following sections we will get to the nitty-gritty of the corresponding configurations.
Configuring SNMP on the managed device
Once you have installed and started snmpd in the CentOS 7 box, the variables are only accessible from that host. We need to allow the Ubuntu box to query those variables. To do that, rename /etc/snmp/snmpd.conf to /etc/snmp/snmpd.conf.orig, and -for simplicity- create a new snmpd.conf file with only the following lines in it. The last three lines (beginning with disk) represent the mount points of existing root, projects, and backups logical volumes, where we will want to check the percentage of disk usage via SNMP:
rocommunity public 192.168.0.0/24
disk /
disk /home/projects
disk /home/backups
After restarting snmpd, hosts in the 192.168.0.0/24 network will be allowed to query (ro: read-only) the SNMP variables from the CentOS 7 machine.
Configuring Nagios for SNMP
To read or set variables via SNMP, object identifiers (OIDs) are used. A list of common OIDs are available in http://www.oid-info.com/basic-search.htm.
Here are some sample OIDs that we are going to use in this guide:
- System uptime: 1.3.6.1.2.1.25.1.1.0
- Percentage of disk space usage (first mount point indicated in snmpd.conf): 1.3.6.1.4.1.2021.9.1.9.1
- Percentage of disk space usage (second mount point indicated in snmpd.conf): 1.3.6.1.4.1.2021.9.1.9.2
- Percentage of disk space usage (third mount point indicated in snmpd.conf): 1.3.6.1.4.1.2021.9.1.9.3
- Total RAM installed: 1.3.6.1.4.1.2021.4.5.0
Object IDentifiers are unique across devices and vendors. In other words, the same information is accessible using the same OID. However, some vendors may have specific OIDs for their devices.
In the Nagios server, make sure the following block is present in /usr/local/nagios/etc/objects/commands.cfg:
define command{
command_name    check_snmp
command_line    $USER1$/check_snmp -H $HOSTADDRESS$ $ARG1$
}
And append the following command definitions to the same file. They will be used to check the uptime, the percentage of disk usage, and the total RAM installed.
# Uptime via SNMP
define command{
command_name    SNMP-Uptime
command_line    $USER1$/check_snmp -o 1.3.6.1.2.1.25.1.1.0 -H $HOSTADDRESS$ $ARG1$
}
# Percentage of disk usage (/)
define command{
command_name    SNMP-DiskUsagePercentageRoot
command_line    $USER1$/check_snmp -o 1.3.6.1.4.1.2021.9.1.9.1 -H $HOSTADDRESS$ $ARG1$ -w 60 -c 80
}
# Percentage of disk usage (/home/projects)
define command{
command_name    SNMP-DiskUsagePercentageProjects
command_line    $USER1$/check_snmp -o 1.3.6.1.4.1.2021.9.1.9.2 -H $HOSTADDRESS$ $ARG1$ -w 60 -c 80
}
# Percentage of disk usage (/home/backups)
define command{
command_name    SNMP-DiskUsagePercentageBackups
command_line    $USER1$/check_snmp -o 1.3.6.1.4.1.2021.9.1.9.3 -H $HOSTADDRESS$ $ARG1$ -w 60 -c 80
}
# Total RAM installed
define command{
command_name    SNMP-TotalRAMInstalled
command_line    $USER1$/check_snmp -o 1.3.6.1.4.1.2021.4.5.0 -H $HOSTADDRESS$ $ARG1$
}
Finally, we will add the corresponding service definitions to apply the above commands to our CentOS box. To do that, insert the following lines in /usr/local/nagios/etc/servers/centos7.cfg:
define service{
use                     generic-service
host_name               centos7
service_description     System uptime
check_command           SNMP-Uptime!-C public
}
define service{
use                     generic-service
host_name               centos7
service_description     Disk used percentage of /
check_command           SNMP-DiskUsagePercentageRoot!-C public
}
define service{
use                     generic-service
host_name               centos7
service_description     Disk used percentage of /home/projects
check_command           SNMP-DiskUsagePercentageProjects!-C public
}
define service{
use                     generic-service
host_name               centos7
service_description     Disk used percentage of /home/backups
check_command           SNMP-DiskUsagePercentageBackups!-C public
}
define service{
use                     generic-service
host_name               centos7
service_description     System uptime
check_command           SNMP-Uptime!-C public
}
Once Nagios is restarted, we can open the web user interface and check the status of the services that we just defined as we can see in Fig. 2:
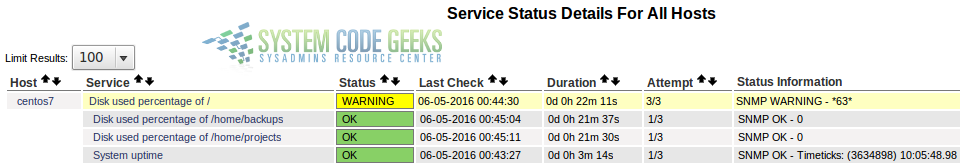
The WARNING status in the percentage of disk usage corresponding to the root partition is caused by the -w flag followed by 60 in the SNMP-DiskUsagePercentageRoot command definition; that is, raise a warning message if the disk usage is above 60%.
Summary
In this article we have reviewed some essential concepts about SNMP and explained how to configure Nagios to monitor system metrics in the managed device using that protocol. To check other types of network devices, consult the specific documentation. The only difference is that you will not need to set up a SNMP agent in a network printer, or a router. The rest of this guide should apply to such cases without major modifications.

very nice
Hi, i would be happy if you can help. is it possible to configure it all other way, means : not with snmp. so when the switch is down or a Port has problem, he should send a report to Nagios with asking the Switch. i dont know if i make a point here, but i think it would be awesome if it works, because the Nagios check if anything is down or not wokring then we get an email or it is going to be Red, so i want it all other way if it possible. thanks in Advance.… Read more »